QR Code Analytics: The Complete Guide to What to Track and How to Use It (2026)
The complete guide to QR code analytics - which metrics matter, how to interpret scan data by use case, UTM tracking, and the common reporting mistakes.
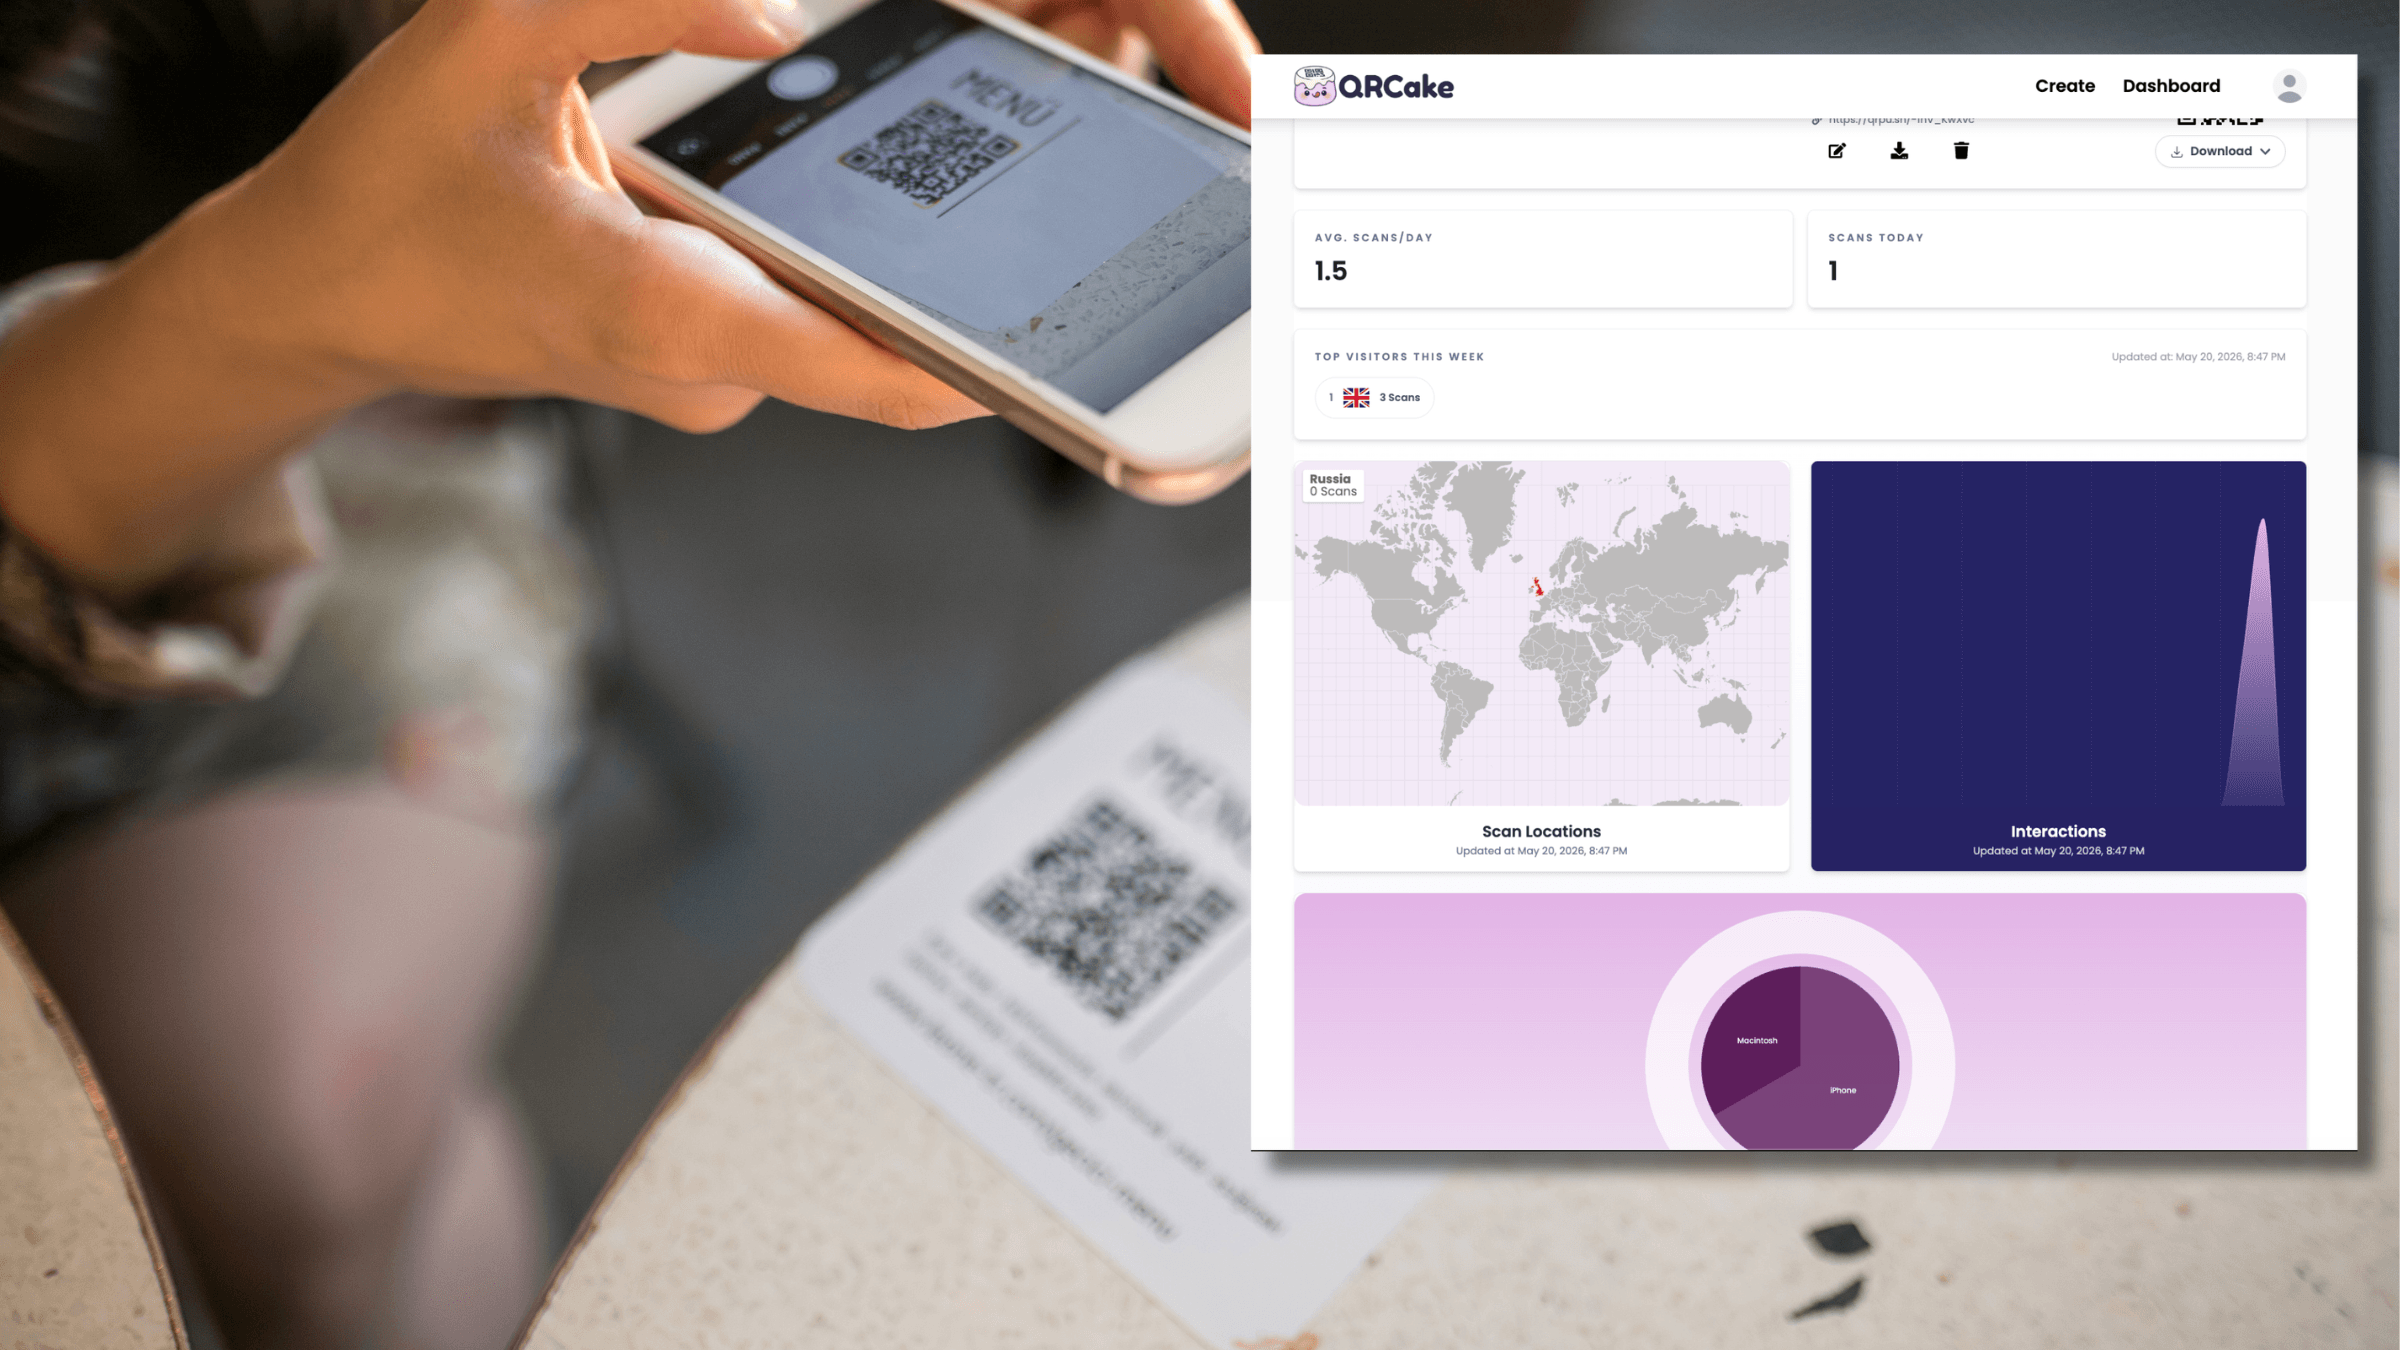
But "having analytics" doesn't automatically mean "using analytics well." Most QR users either look at scan counts and stop there (missing the harder signals) or get lost in vanity dashboards (counting things that don't matter).
This guide covers what scan analytics actually capture, the metrics that matter for each use case, how to interpret the patterns, and how to extend QR analytics with the destination page's own tracking.
The 30-second version
QR code analytics give you five core measurements:
- Total scans - how many times the code was scanned.
- Unique scans - how many distinct devices scanned it.
- Geography - where in the world the scans happened.
- Device and OS - iPhone vs Android vs other.
- Time - when the scans happened (date, time of day, day of week).
That's it on the QR side. Anything beyond this - what the user did after landing on the destination, whether they bought something, whether they completed a form - requires analytics on the destination page itself (Google Analytics, Plausible, or similar).
The trick is connecting the two so you can answer the questions that actually matter: "Did this campaign work?" "Which placement converts?" "What should I do more of?"
What QR providers actually track (and don't)
Every dynamic QR provider tracks what happens at the moment of redirect. The scan is a HTTP request to the provider's server, and the server logs:
- Timestamp. When the scan happened.
- IP address. Used to infer rough geography (country, sometimes city). Most providers don't store the raw IP for long.
- User agent string. Tells the provider the device type, OS, and browser version.
- Referrer. Usually empty for QR scans (the camera doesn't pass a referrer), but sometimes present if the QR was scanned from within an app.
From these raw signals, the provider's analytics dashboard infers:
- Country (and sometimes city) of scan
- Device type (mobile, tablet, occasionally desktop)
- Operating system (iOS, Android, etc.) and version
- Phone brand on Android (Samsung, Pixel, Xiaomi, etc.)
- Whether the scan came from inside an app (Instagram's in-app browser, etc.)
What QR providers don't track:
- What the user did after scanning. The provider sees the redirect; what happens after the user reaches your destination is on your server, not theirs.
- Whether the user is a repeat visitor. Most providers use cookies or IP-plus-fingerprint heuristics to identify unique scans, but these are imperfect - a user scanning twice from different networks looks like two users.
- The user's identity. Scan analytics are anonymous; you don't know who scanned, only that someone did.
- The exact time spent at the destination. That's destination-page analytics, not QR analytics.
This is important to understand: QR analytics tell you about the scan event. They don't tell you about the outcome.
The five core metrics and how to read them
1. Total scans
The most-obvious metric. Total scans tells you how often the code was used.
Useful for:
- Comparing placements (this code got 50 scans, that one got 200).
- Tracking campaign performance over time.
- Setting baseline expectations.
Limitations:
- Doesn't tell you about quality of engagement.
- Easily distorted by one curious user scanning multiple times.
- Doesn't account for placements with very different volume potential (a sign on a busy street vs a sticker on a small package).
What "good" looks like:
Varies enormously by context. A restaurant table standee getting 5-10 scans per day per table is healthy. A packaging QR getting 100 scans per 10,000 units shipped is reasonable. A trade show booth code getting 50 scans over a 3-day event is solid. There's no universal benchmark; track against your own past performance.
2. Unique scans
How many distinct devices scanned the code. Calculated by the provider using IP, cookies, and fingerprinting.
Useful for:
- Understanding genuine reach (vs total scans, which include repeats).
- Spotting placements where one user is scanning many times (testing, troubleshooting, or genuine repeat engagement).
- Estimating cost-per-engagement for paid campaigns.
Ratio interpretation:
- High unique-to-total ratio (0.8+): mostly one-time scans. Typical for marketing QRs where users scan, get the info, and don't come back.
- Low unique-to-total ratio (0.4 or below): lots of repeat scanning. Could mean a useful reference (a manual or daily-updated menu) or a broken destination (users scanning multiple times trying to make it work).
3. Geography
Country, region, and sometimes city of each scan.
Useful for:
- Confirming a campaign reached its intended audience.
- Spotting unexpected interest from outside your target market.
- Validating that physical placements drive local scans (vs cross-regional digital virality).
Common patterns:
- Local-only scans: typical for in-store placements, restaurant menus, neighbourhood signage.
- Wide geographic spread: typical for packaging codes that ship globally, or codes that have been shared digitally.
- Concentrated remote spikes: often signal that the code was photographed and shared on social media. Worth investigating who shared it and where.
4. Device and OS
The device type and operating system used to scan.
Useful for:
- Optimising the destination page for the dominant device.
- Spotting accessibility issues (if older Androids are scanning but not converting, the destination might not work well on older Android browsers).
- Understanding your audience's tech profile.
Typical patterns:
- Heavily iOS-skewed (70%+ iPhone): typical of higher-income, US/UK markets, design-conscious audiences.
- Heavily Android-skewed (70%+ Android): typical of global markets, mass-market consumer products, lower-income segments, and most of the world outside North America and Western Europe.
- Roughly 50/50: typical of broad domestic audiences in the UK or US.
The most important implication: optimise your destination for whichever device dominates your scans. If 80% of your customers are on iPhone, the page needs to look perfect in Safari. If 80% are on Android, test Chrome and Samsung Internet equally.
5. Time patterns
When scans happen - by hour of day, day of week, date.
Useful for:
- Staffing decisions (restaurants, retail).
- Campaign timing optimisation.
- Spotting unexpected scan spikes (often signal coverage, social shares, or a campaign hitting its audience).
Common patterns:
- Restaurant menu codes: spike at meal times (12-2pm, 6-9pm).
- Packaging codes: spread throughout the day with a slight evening peak (when people unbox and use products).
- B2B codes: weekday-heavy with morning and mid-afternoon peaks.
- Marketing campaign codes: depends entirely on the campaign's media schedule.
Sudden spikes outside the normal pattern often signal a viral share, a press mention, or a competitor scanning to check on you. Worth investigating each time.
Connecting QR analytics to destination-page analytics
The serious work happens when you connect QR scan data to what users do after landing.
The setup:
- Add UTM parameters to your dynamic QR's destination URL. This passes campaign info to your destination page's analytics.
- Track destination-page metrics in Google Analytics, Plausible, or your CMS's built-in analytics.
- Cross-reference QR scan counts with destination engagement metrics to see whether scans convert.
UTM parameter template for QR codes:
A typical URL looks like `yoursite.com/landing?utm_source=qr&utm_medium=print&utm_campaign=summer-2026&utm_content=table-standee`. Each parameter:
- `utm_source=qr` - tells you it came from a QR code (not search, email, etc.).
- `utm_medium=print` - distinguishes printed QRs from digital QRs.
- `utm_campaign=summer-2026` - the campaign name.
- `utm_content=table-standee` - the specific placement (vs window-sticker, vs receipt, etc.).
Now you can see in Google Analytics: not just "100 scans" but "100 scans, 65 reached the destination, 12 converted to bookings." That's the full picture.
If you're just starting out, a free QR Cake account is enough to get the five core metrics - scans, unique scans, country, device, and time - without committing to a paid analytics platform. The dashboard is intentionally lightweight, which is the right level of complexity for a small business running a handful of codes; teams running hundreds of codes will eventually want a heavier-weight option, but most users never reach that point.
The metrics that matter at the destination:
- Bounce rate. Were users scanning, looking, and leaving? Or scanning and engaging?
- Time on page. Did they actually read?
- Scroll depth. Did they read past the headline?
- Form completions / conversions. Did they take the desired action?
- Click-through to next steps. Did they continue into your funnel?
Use-case-specific analytics interpretation
How to use scan data in different contexts:
Restaurant menus
- Daily scans correlate roughly with covers - useful staffing signal.
- Spike at meal times confirms the code is being used by diners (vs accidentally elsewhere).
- A drop on certain days might indicate the standee was moved, knocked over, or damaged.
- Compare across tables (if you use per-table codes) to find your highest-traffic seating.
Packaging codes
- Total scans against units shipped gives you the scan rate (typical: 1-5% of units).
- Geographic distribution confirms where your retail distribution is actually selling.
- Time-of-day pattern reveals when customers use the product (evening for dinner products, morning for breakfast, etc.).
- A sustained spike in a region often signals new retail distribution or a local press mention.
Marketing campaigns (flyers, ads, posters)
- Compare scan counts across placements to find what worked.
- Cross-reference with destination conversions to find which placement converts (not just scans).
- Time-decay pattern after a campaign launch tells you how long the printed asset stays effective.
Real estate
- Per-property scan trends predict buyer interest (often before offers come in).
- Sharp scan drop-off after week 2 may indicate the listing needs new marketing energy or pricing.
- Remote scans (out-of-region) often indicate relocation buyers - different sales motion.
Trade shows and events
- Compare booth-by-booth or session-by-session.
- Spike during specific time windows reveals when the audience was most engaged.
- Post-event scans (in the week after) reveal post-event follow-up interest - often more valuable than scans during the event.
Business cards
- Trickier because card distribution is highly variable. But:
- Scan timing relative to a specific event (a conference, a networking event) tells you which events generated card-following interest.
- Geographic spread reveals whether your network is local or remote.
Common QR analytics mistakes
Mistake 1: Tracking scans without tracking destination conversion. Scans alone don't tell you whether the campaign worked.
Mistake 2: Using a static QR code. Static codes give you zero analytics. If analytics matter at all, use dynamic.
Mistake 3: One shared QR code across all placements. You lose the ability to compare placements. Generate a separate code per placement.
Mistake 4: Not adding UTM parameters. Without UTMs, your destination-page analytics can't distinguish QR traffic from other sources.
Mistake 5: Reading "high scans" as "success." Scan count is a vanity metric without conversion data. A code with 1,000 scans and 0 bookings underperformed a code with 200 scans and 30 bookings.
Mistake 6: Comparing unrelated time periods. "January scans were higher than July" might just mean the campaign was new in January. Compare like-for-like periods.
Mistake 7: Acting on small sample sizes. Under 50 scans, individual variations are noise. Wait for enough volume before drawing conclusions.
Mistake 8: Ignoring the OS split. If most scans are on a device you didn't optimise for, your conversion rate is artificially low.
Mistake 9: Treating analytics as a one-time check. Review monthly. Patterns shift; campaigns age; placements get damaged.
Mistake 10: Forgetting privacy compliance. Aggregated scan analytics are typically anonymised, but if you combine QR data with personal data (email signups, etc.), GDPR and similar regulations apply. Have a privacy policy that covers this.
What to do with your QR analytics each month
A monthly QR review takes 20 minutes and saves time everywhere else:
- Pull the scan counts for each placement. Compare against last month and last year (if available).
- Identify the top and bottom placements by scans. Decide whether top placements need more support and bottom placements need to be moved or removed.
- Cross-reference with destination conversions. Are scans converting at the expected rate? If not, the destination page may need optimisation.
- Spot anomalies. Unexpected spikes, drops, or geographic outliers. Investigate each.
- Note any insights for next month. What's the one thing you'll change based on this data?
Done monthly, this becomes a small but compounding source of insight about which campaigns and placements actually pay for themselves.
Frequently asked questions
Can I see who scanned my QR code? No. QR analytics are anonymous. You see scan events, not user identities. If you connect QR scans to a form submission (which captures email or name), you can correlate scans with the people who completed the form - but the raw scan is anonymous.
Are static QR codes trackable? No. Static QR codes connect directly from the visitor's phone to the destination URL with no provider in the middle. Without a provider, no analytics. If you want analytics, use dynamic codes.
Do QR analytics work in real time? Most providers update dashboards within seconds to minutes of a scan. Real-time scan notifications are usually available on paid plans.
Can I export QR analytics to other tools? Most providers offer CSV export of scan data, and many have APIs for programmatic access. If you want to do deep analysis in BI tools (Looker, Tableau, etc.), look for providers with API access on the plans you can afford.
How long do QR providers keep scan data? Varies by provider. Free plans typically keep 30-90 days of data; paid plans usually 1-2 years. Check before assuming long-term data will be available.
Can I use Google Analytics with QR codes? Yes, by adding UTM parameters to your QR's destination URL. The QR provider tracks the scan; Google Analytics tracks what happens after.
Do QR analytics respect user privacy? Aggregated analytics (counts, geographic patterns, device splits) are typically anonymised. Cookies and fingerprinting for unique-scan detection have privacy implications. Most providers handle GDPR compliance for you, but you remain responsible for your privacy policy.
Why do unique scans and total scans differ? Unique scans count distinct devices; total scans count all scan events. The same device scanning twice counts as 1 unique and 2 total. Some providers identify unique users by cookies, some by device fingerprinting, some by both.
Can I see which page on my site a QR scan ended up on? Yes, via destination-page analytics (Google Analytics, etc.) using UTM parameters. The QR provider only tracks the initial scan; the destination tracks subsequent navigation.
How do I measure QR campaign ROI? Track scans (QR provider), conversions (destination analytics), and revenue (your CRM or sales system). Multiply through and divide by campaign costs. The numbers are rarely exact, but the ratio gives you a clear go/no-go signal for similar future campaigns.
Bottom line
QR analytics are useful but not the whole picture. They tell you the scan happened; your destination-page analytics tell you what mattered. Wire them together with UTM parameters and you have the full picture.
Review monthly, act on patterns rather than single data points, and use the data to improve what you do next - not just to admire what you've already done.
Create a free dynamic QR code with built-in QR Cake analytics
Ready to make your own QR code?
Create a dynamic QR code you can edit after printing. Free to start, no card required, unlimited scans, and your codes never expire.

About the QR Cake team
Written by the QR Cake team - the people building QR Cake, a dynamic QR code platform used for editable print campaigns, Canva QR codes, scan analytics, and long-lived QR redirects that keep working after subscriptions end.
Learn more about QR CakeFrequently asked questions
- Can I see who scanned my QR code?
- No. QR analytics are anonymous. You see scan events, not user identities. If you connect scans to a form submission that captures contact info, you can correlate - but the raw scan is anonymous.
- Are static QR codes trackable?
- No. Static QR codes connect directly from the visitor's phone to the destination URL with no provider in the middle, so there are no analytics. Use dynamic codes if analytics matter.
- Can I use Google Analytics with QR codes?
- Yes, by adding UTM parameters to your QR's destination URL. The QR provider tracks the scan; Google Analytics tracks what happens after.
- How long do QR providers keep scan data?
- Varies by provider. Free plans typically keep 30-90 days; paid plans usually 1-2 years. Check before assuming long-term data will be available.
- Why do unique scans and total scans differ?
- Unique scans count distinct devices; total scans count all scan events. The same device scanning twice counts as 1 unique and 2 total. Providers use cookies or device fingerprinting to detect uniqueness.
- How do I measure QR campaign ROI?
- Track scans via the QR provider, conversions via destination analytics with UTM parameters, and revenue via your CRM. Multiply through and divide by campaign costs to get a clear go/no-go signal.
Related Articles
Keep reading practical QR code guides, examples, and optimization tips.
The QR Code Placement Playbook: Where to Put Codes for Maximum Scans
A perfectly-designed QR code in the wrong location gets ignored. A merely-adequate code in the right spot generates hundreds of scans. Placement matters more than people realise.
15 QR Code Call-to-Action Examples That Increase Scans (2026)
An unlabelled QR code gets a fraction of the scans of a labelled one. The CTA next to the code is the highest-ROI editorial change you can make to any QR programme.
How to Create a Google Review QR Code (Step-by-Step, 2026)
Google reviews drive local search rankings, trust, and conversion. A QR code that takes customers directly to your review form removes the single biggest barrier to actually leaving one.